Why Rate Analysis is Killing Your Margins
You’re probably losing more money than you think on rate analysis. Let’s be honest—most contractors either overestimate or underestimate costs because their rate analysis isn’t grounded in reality. You think you’ve nailed the BOQ. Then the project starts, and suddenly your labor costs are 15% higher, or your material supplier ups their rates halfway through.
Here’s the brutal truth: sloppy rate analysis erodes margins every single day. And the worst part? You often don’t notice until the project’s halfway done. A 2023 McKinsey report on construction margins found that poor cost tracking contributes to 11% of overall revenue leakage. Let’s not even talk about how much time it takes—weeks of flipping through outdated rate books, Excel files, and vendor quotes. Sound familiar?
This article dives deep into the problem, breaks down the anatomy of rate analysis, and provides actionable strategies to protect your margins. We’ll also explore tools like JobNext that simplify rate analysis for contractors.
The Anatomy of Rate Analysis
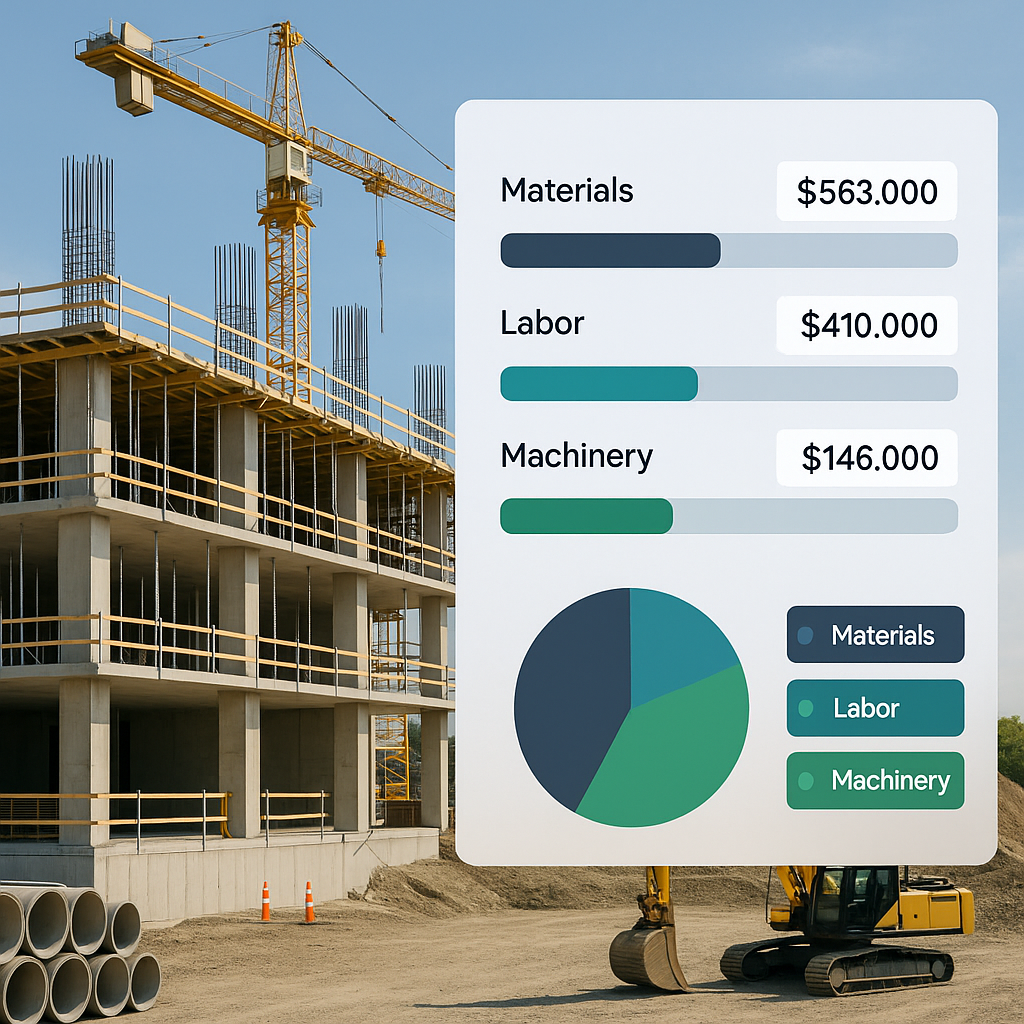
Rate analysis in civil works boils down to three components:
| Component | What It Includes |
|---|---|
| Materials | Cement, steel, sand, aggregate, pipes, fittings—quantities, unit rates, and specs. |
| Labour | Workforce time (e.g., masons, carpenters) and hourly wages. |
| Plant & Machinery | Equipment usage, fuel, depreciation, and idle time costs. |
Step-by-Step Breakdown
-
Materials:
- Quantities: Accurately calculate quantities required from detailed drawings and BOQs.
- Unit Rates: Use real-time market rates or locked-in rates from your suppliers.
- Specifications: Ensure material specs match the contract terms (e.g., M25 concrete vs. M20).
-
Labour:
- Break down required man-hours by skill level (e.g., carpenters, masons, helpers).
- Factor in local wage rates, overtime, and efficiency variations.
-
Plant & Machinery:
- Include fuel costs (diesel, electricity), equipment rental rates, and operator wages.
- Don’t forget depreciation for owned machinery and idle time for unused equipment.
The goal is to calculate the Scheduled Rate per Unit of Measure (UOM). For example, if you’re building a retaining wall, you break it down to total material cost, labor hours, and machinery usage per cubic meter (CUM).
Common Mistakes That Destroy Margins
1. Ignoring Real-World Variables
Many contractors fail to adjust their rate analysis for factors like:
- Fluctuating Material Prices: Steel prices rose by over 30% in 2021, yet many contractors stuck to outdated rates.
- Labor Productivity: A 2020 Dodge Data Report found that labor productivity can vary by up to 25% depending on site conditions, weather, and experience levels.
- Equipment Utilization: Idle machinery costs you money—whether it’s from delays or poor planning.
2. Over-Reliance on Historical Data
While historical data is helpful, it’s not always reliable. For instance, if you’re estimating plastering costs based on a project from two years ago, you’re likely missing recent changes in labor and material costs.
3. Lack of Regular Updates
Rate analysis is not a one-time activity. Without ongoing updates, you risk major variances between your budgeted and actual costs.
The Fix: Scheduled Rates in JobNext
This is where having the right tools can save your margins. Platforms like JobNext include a Scheduled Rates feature that simplifies rate analysis. Instead of manually calculating costs for every BOQ item, you can:
- Define Standard Rates: Populate the WBS (Work Breakdown Structure) with predefined unit rates for activities like excavation, concreting, or formwork. Each rate is broken into materials, labor, and plant components.
- Link to Rate Contracts: Automatically pull material costs from negotiated rate contracts (e.g., cement, steel). This ensures your estimates align with actual procurement costs.
- Variance Monitoring: Compare your quoted rate, budgeted rate, and actual cost rate in real-time dashboards. Spot discrepancies early before they wreck your profit margins.
Their own documentation shows how Scheduled Rates include material specs, quantities, and unit costs, giving you a transparent and defensible cost breakdown. No more guesswork.
Expanded Example: Excavation Rate Analysis
Let’s break down excavation costs for a project:
| Cost Component | Details | Cost (₹/CUM) |
|---|---|---|
| Materials | Diesel (15 liters @ ₹80/liter) | ₹1,200 |
| Labour | Excavator operator (8 hours @ ₹500/hour) | ₹4,000 |
| Plant | Equipment depreciation + maintenance | ₹2,500 |
| Total | ₹7,700 |
Without accurate rate analysis, you might quote ₹6,500/CUM thinking you’re competitive. But when the actual cost hits ₹7,700/CUM, you’re bleeding ₹1,200 per cubic meter. Multiply that by 10,000 CUM, and you’ve just lost ₹1.2 crore on one scope item.
How to Avoid This Loss:
- Use Real-Time Data: Update diesel prices weekly, especially during volatile markets.
- Account for Contingencies: Add a buffer of 5-10% for material and labor cost variances.
- Monitor Worksite Productivity: Track actual excavation rates (CUM/day) for better forecasting.
Don’t Forget Variance Analysis
Once your project is live, you need to keep tracking costs. This is where JobNext’s BOQ rate analysis tools shine. You can compare five rate dimensions for every scope item:
- Quoted Rate: What you submitted in the bid.
- Scheduled Rate: Predefined cost per UOM.
- Budgeted Rate: Adjusted for project contingencies.
- Billing Rate: What you’re invoicing the client.
- Actual Cost Rate: Real costs from procurement and payroll.
Case Study: Real-World Project Oversight
In 2022, a mid-sized contractor in Bangalore noticed a 20% variance in the actual cost of labor for a retail construction project. By using JobNext’s variance analysis, they identified that a delay in material delivery caused an idle labor cost of ₹15 lakhs. Early detection allowed them to negotiate with the client for an additional time extension and cost compensation.
Actionable Steps to Improve Rate Analysis
-
Start with Standardized Rates:
- Build rate schedules for your most common activities. Platforms like JobNext can help you set these up during preconstruction. Have separate rate templates for residential, commercial, and industrial projects.
-
Lock in Rate Contracts:
- Negotiate volume-based pricing for key materials before mobilizing. Tools like JobNext let you attach signed rate contracts directly to procurement records for future reference.
-
Monitor Variances Weekly:
- Don’t wait until the end of the project. Use dashboards to track where your budget is slipping in real-time. Set thresholds for acceptable variance and get alerts when they’re breached.
-
Train Your Team:
- Ensure your estimators and project managers are trained in using modern rate analysis tools. Host workshops or partner with tech providers like JobNext for ongoing support.
-
Leverage Historical Data Wisely:
- Use historical data as a baseline but adjust for market conditions, labor trends, and project-specific challenges.
Comparison Table: Manual vs. Automated Rate Analysis
| Aspect | Manual Rate Analysis | Automated Rate Analysis (e.g., JobNext) |
|---|---|---|
| Time Required | Weeks per project | Hours per project |
| Accuracy | Prone to human error | High precision |
| Data Updates | Infrequent | Real-time |
| Cost Tracking | Limited | Comprehensive dashboards |
| Scalability | Difficult for large projects | Easily scalable |
FAQ
1. How often should I update my rate analysis?
It depends on the project duration and market volatility. For long-term projects, update material and labor rates at least monthly. In highly volatile markets, consider weekly updates.
2. What’s the best way to negotiate rate contracts?
Start by analyzing your historical demand for key materials. Use this data to negotiate volume-based discounts with suppliers. Document agreements in clear contracts and link them to your procurement system.
3. How can I ensure my rate analysis is competitive?
Benchmark against industry standards and competitors. Use tools like JobNext to integrate real-time market data into your rate calculations.
4. What’s the biggest risk in rate analysis?
The biggest risk is underestimating costs, especially labor and material price fluctuations. This can lead to significant margin erosion or even project losses.
5. Can small contractors afford tools like JobNext?
Yes, many platforms offer tiered pricing models. For small contractors, the ROI often outweighs the subscription cost due to time savings and improved accuracy.
Why This Matters
In civil works, even small errors in rate analysis can snowball into massive losses. A single ₹1,000 variance per BOQ item can erode ₹10–15 lakh from your margins on a mid-sized project. That’s why tools like JobNext are game-changers for contractors serious about profitability.
For more insights on how tech can streamline your estimation process, check out this guide from EstimateNext. They explain how AI-driven tools save time and prevent costly errors during bidding.
Looking to fix rate analysis in your projects? JobNext simplifies cost tracking and variance analysis so you can protect your margins. Get started now →
Learn more at EstimateNext